
Introduction:
The spinning top candlestick pattern is a significant indicator in technical analysis used by traders to understand market sentiment and potential reversals in price direction. In this comprehensive guide, we will delve into the intricacies of spinning top candlesticks, covering their definition, characteristics, interpretation, and practical applications.
Understanding Spinning Top Candlesticks
Definition:
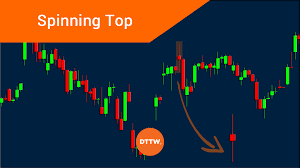
A spinning top candlestick is a type of candlestick pattern characterized by a small body and long upper and lower shadows. It typically forms when the opening and closing prices are close to each other, resulting in a candlestick with a short body. However, during the trading period, there is significant price fluctuation, leading to the formation of long shadows above and below the body.
Characteristics:
1. Small Body:
The body of a spinning top candlestick is relatively small, indicating indecision between buyers and sellers.
2. Long Upper and Lower Shadows:
The presence of long shadows signifies that there was considerable price movement during the trading period.
3. Close Opening and Closing Prices:
The opening and closing prices are usually very close to each other, reflecting the tug-of-war between bulls and bears.
4. Color:
Spinning top candlesticks can be of any color, depending on whether the closing price is higher or lower than the opening price.
Interpretation of Spinning Top Candlesticks
Market Sentiment:
The formation of a spinning top candlestick suggests indecision in the market. It indicates that neither buyers nor sellers have gained control, resulting in a stalemate. This indecision often occurs after a significant price movement and could signal a potential reversal or consolidation.
Reversal Signals:
When a spinning top candlestick forms after a prolonged uptrend or downtrend, it could indicate a possible reversal. In an uptrend, a spinning top candlestick suggests that buying pressure is weakening, while in a downtrend, it implies that selling pressure is subsiding.
Continuation Patterns:
In some cases, spinning top candlesticks can also act as continuation patterns. If they appear within a consolidation phase or a trading range, they may signal that the prevailing trend is likely to continue after the period of indecision resolves.
Volume Analysis:
Volume analysis can complement the interpretation of spinning top candlesticks. High volume accompanying a spinning top candlestick reinforces its significance, indicating increased uncertainty and the potential for a more significant price move.
Practical Applications and Trading Strategies
Confirmation:
To increase the reliability of signals generated by spinning top candlesticks, traders often look for confirmation from other technical indicators or chart patterns. This could include trendlines, moving averages, or oscillators like the Relative Strength Index (RSI) or the Moving Average Convergence Divergence (MACD).
Entry and Exit Points:
Traders can use spinning top candlesticks to identify potential entry and exit points for their trades. For example, a trader may wait for confirmation of a reversal after a spinning top forms at a key support or resistance level before entering a trade.
Stop Loss Placement:
Spinning top candlesticks can also help traders determine appropriate stop-loss levels. Placing a stop-loss order beyond the high or low of the spinning top candlestick can help manage risk and protect capital in case the trade goes against expectations.
Multiple Timeframe Analysis:
To gain a more comprehensive view of market dynamics, traders often employ multiple timeframe analysis when using spinning top candlesticks. This involves analyzing the same asset across different timeframes to confirm signals and identify potential trading opportunities.
Conclusion
In conclusion, spinning top candlesticks are valuable tools in the technical analyst’s toolkit, providing insights into market sentiment and potential price reversals. By understanding their characteristics and interpreting their signals in conjunction with other technical indicators, traders can make informed trading decisions and improve their chances of success in the financial markets. Whether used in isolation or as part of a broader trading strategy, spinning top candlesticks offer valuable insights into market dynamics and price action.
FAQ’s:
- What is a spinning top candlestick?
A: A spinning top is a candlestick pattern characterized by a small body with upper and lower shadows that are longer than the body itself. It indicates indecision in the market between buyers and sellers.
- What does a spinning top candlestick indicate?
A: A spinning top suggests that neither buyers nor sellers were able to gain control during the trading period. It reflects market indecision or a potential reversal of the current trend.
- How do you interpret a spinning top candlestick in technical analysis?
A: In technical analysis, a spinning top candlestick can signal a potential trend reversal or continuation, depending on its context within the price action and the overall market trend. Traders often look for confirmation from other technical indicators or price patterns before making trading decisions based on a spinning top.
- What are the key characteristics of a spinning top candlestick?
A: The key characteristics of a spinning top candlestick include a small body (open and close prices are close together), long upper and lower shadows (indicating price volatility and indecision), and the absence of a clear bullish or bearish bias.
- How reliable is a spinning top candlestick pattern?
A: The reliability of a spinning top pattern depends on various factors, including the timeframe, market conditions, and confirmation from other technical indicators or price action patterns. While spinning tops can provide valuable insights into market sentiment, traders often use them in conjunction with other tools for more accurate analysis.
- What trading strategies can be used with spinning top candlesticks?
A: Traders may use spinning top candlesticks as signals to enter or exit trades, depending on the context. For example, a spinning top after a prolonged uptrend may signal a potential reversal, prompting traders to consider selling or shorting positions. Conversely, a spinning top in a downtrend may suggest a possible reversal to the upside.
- Are there variations of the spinning top candlestick pattern?
A: Yes, there are variations of the spinning top pattern, such as the long-legged doji and the dragonfly doji, which have similar characteristics but slightly different shapes. These variations may have nuanced implications for market sentiment and price action.
- Can spinning top candlesticks occur in any market?
A: Yes, spinning top candlesticks can occur in any market, including stocks, forex, commodities, and cryptocurrencies. They are a universal candlestick pattern used by traders to analyze market sentiment and make trading decisions.
- How can traders incorporate spinning top candlesticks into their trading strategies?
A: Traders can incorporate spinning top candlesticks into their trading strategies by using them as part of a comprehensive technical analysis toolkit. This may involve looking for confirmation signals from other indicators or price patterns, managing risk effectively, and maintaining a disciplined approach to trading.
- Is it essential to consider the overall market context when interpreting spinning top candlesticks?
A: Yes, considering the overall market context is crucial when interpreting spinning top candlesticks. Factors such as trend direction, support and resistance levels, volume, and market sentiment can provide valuable insights into the significance of a spinning top pattern and its potential implications for future price action.