
Introduction:
In the realm of technical analysis, traders often rely on various candlestick patterns to identify potential changes in market direction. One such pattern that holds significance is the shooting star candlestick. This pattern, with its unique appearance, can provide valuable insights into market sentiment and potential reversal points. In this guide, we will delve into the intricacies of the shooting star candlestick pattern, exploring its formation, characteristics, and implications for traders.
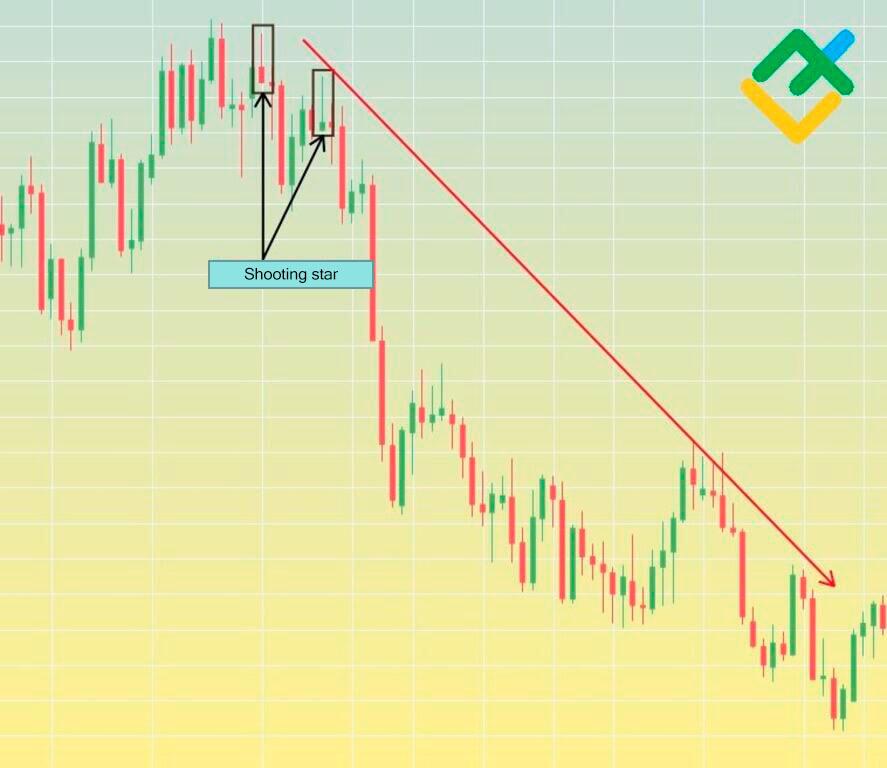
Understanding the Shooting Star Candlestick Pattern:
The shooting star candlestick pattern is a single candlestick pattern that typically occurs at the end of an uptrend. It is characterized by a small body located at the bottom of the candlestick and a long upper shadow, which is at least twice the length of the body. The upper shadow represents the intraday high reached by the price, while the body signifies the opening and closing prices. The presence of a small body near the low of the session indicates that sellers were able to drive prices down significantly from the highs, suggesting a potential reversal in momentum.
Key Components of the Shooting Star Pattern:
1. Small Body:
The small body of the candlestick indicates a narrow trading range between the opening and closing prices.
2. Long Upper Shadow:
The elongated upper shadow reflects the rejection of higher prices and the emergence of selling pressure during the trading session.
3. Short Lower Shadow:
The absence or presence of a short lower shadow is not a strict requirement for the shooting star pattern but adds to its significance if present.
Formation and Interpretation:
The shooting star pattern forms when the market opens higher, trades significantly higher during the session, but closes near its opening price, or even lower. This price action suggests that buyers initially pushed prices higher but encountered strong resistance from sellers, causing the price to retreat from its highs. The long upper shadow indicates that sellers gained control during the session, potentially signaling a reversal of the prevailing uptrend.
Implications for Traders:
Traders often interpret the shooting star candlestick pattern as a bearish reversal signal, especially when it occurs after a prolonged uptrend. The pattern suggests that the buying pressure that propelled prices higher is weakening, and sellers may be stepping in to take control. Consequently, traders may consider taking short positions or liquidating long positions to capitalize on the anticipated downward movement in prices.
Confirmation and Risk Management:
As with any technical pattern, it is crucial to seek confirmation from other indicators or signals before making trading decisions based solely on the shooting star pattern. Traders may look for additional bearish signals, such as a decrease in trading volume or the presence of overbought conditions on oscillators like the Relative Strength Index (RSI). Moreover, implementing proper risk management strategies, such as setting stop-loss orders and managing position sizes, can help mitigate potential losses in case the anticipated reversal does not materialize.
Conclusion:
The shooting star candlestick pattern is a powerful tool in the arsenal of technical analysts and traders. Its distinctive appearance and interpretation provide valuable insights into market sentiment and potential trend reversals. By understanding the formation, characteristics, and implications of the shooting star pattern, traders can enhance their ability to identify high-probability trading opportunities and manage risk effectively in dynamic financial markets. However, it is essential to remember that no trading signal is foolproof, and combining the shooting star pattern with other technical tools can improve its reliability and effectiveness in trading decisions.
FAQ’s:
Q: What is the Shooting Star candlestick pattern?
A: The Shooting Star is a bearish reversal candlestick pattern that typically forms after a price rally. It consists of a small body with a long upper shadow and little to no lower shadow.