
Introduction:
In the realm of technical analysis, traders and analysts rely on various patterns to forecast potential market movements. One such pattern that holds significance is the Inverse Head and Shoulders pattern. This pattern is revered for its ability to signal trend reversals, offering traders valuable insights into potential buying opportunities. In this comprehensive guide, we delve into the intricacies of the Inverse Head and Shoulders pattern, exploring its formation, interpretation, and practical implications for traders.
What is the Inverse Head and Shoulders Pattern?
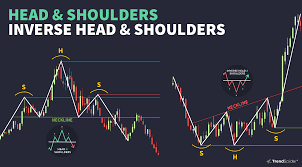
The Inverse Head and Shoulders pattern is a bullish reversal pattern that typically forms after a downtrend. It comprises three troughs with the middle trough (the “head”) being lower than the other two troughs (the “shoulders”). The first and third troughs represent the shoulders, while the second trough forms the head. These troughs are connected by a trendline known as the neckline, which serves as a crucial level for traders to monitor.
Formation of the Pattern:
The formation of the Inverse Head and Shoulders pattern unfolds in several stages. Initially, the price of an asset experiences a prolonged downtrend, characterized by lower lows and lower highs. As selling pressure subsides, the price reaches a bottoming phase, forming the first trough, or the left shoulder. Subsequent selling pressure causes the price to decline further, forming the lowest point of the pattern, known as the head. After the formation of the head, buying interest begins to emerge, leading to a rally in prices, forming the second trough, or the right shoulder. The completion of the pattern occurs when the price breaks above the neckline, confirming a bullish reversal.
Interpreting the Pattern:
Traders interpret the Inverse Head and Shoulders pattern based on its structure and key components. The formation of the left shoulder, head, and right shoulder signifies a shift in market sentiment from bearish to bullish. The neckline serves as a critical level of resistance that, once breached, validates the bullish bias. Additionally, volume plays a crucial role in confirming the pattern’s validity. Typically, volume tends to diminish as the pattern forms, followed by a surge in volume upon the breakout above the neckline, indicating strong buying interest.
Trading Strategies:
Several trading strategies can be employed based on the Inverse Head and Shoulders pattern. One common approach is to enter a long position once the price breaks above the neckline, with a stop-loss set below the right shoulder. Traders often use the height of the pattern (measured from the lowest point of the head to the neckline) to set price targets, projecting a potential upside target upon the breakout. Additionally, some traders prefer to wait for a pullback to retest the neckline after the breakout, viewing it as an opportunity to enter at a more favorable price.
Risk Management:
As with any trading strategy, risk management is paramount when trading the Inverse Head and Shoulders pattern. Traders should always employ proper risk-reward ratios and set stop-loss orders to limit potential losses. Furthermore, it’s essential to consider other technical indicators and market conditions to validate the pattern’s signals and mitigate false breakouts.
Limitations and Considerations:
While the Inverse Head and Shoulders pattern is revered for its bullish reversal signals, it’s not without limitations. Like all technical patterns, it’s prone to false signals, especially in volatile markets. Traders should exercise caution and utilize additional confirmation tools to validate the pattern’s signals. Moreover, market context and fundamental factors should also be taken into account when trading the pattern, as they can influence its efficacy.
Conclusion:
The Inverse Head and Shoulders pattern stands as a powerful tool in the arsenal of technical analysts, offering insights into potential bullish reversals in the market. By understanding its formation, interpretation, and trading strategies, traders can leverage this pattern to identify lucrative trading opportunities while managing risks effectively. However, it’s crucial to exercise prudence and employ proper risk management techniques to navigate the complexities of the financial markets successfully.
FAQ’s:
- What is an Inverse Head and Shoulders pattern?
A: The Inverse Head and Shoulders pattern is a bullish reversal pattern typically seen on price charts. It consists of three troughs: a lower low (the head) between two higher lows (the shoulders). It signifies a potential trend reversal from a downtrend to an uptrend.
- How do you identify an Inverse Head and Shoulders pattern?
A: Look for three consecutive troughs in the price chart. The middle trough (the head) should be lower than the other two (the shoulders). The neckline, formed by connecting the highs of the two shoulders, acts as a resistance level.
- What does the Inverse Head and Shoulders pattern indicate?
A: It suggests that the downtrend is losing momentum and the market sentiment may be shifting from bearish to bullish. Traders often interpret this pattern as a signal to buy, anticipating a potential uptrend.
- How do you trade the Inverse Head and Shoulders pattern?
A: Traders typically wait for the price to break above the neckline after the formation of the pattern. This breakout is seen as confirmation of the reversal. Some traders may enter long positions at this point, with a stop-loss set below the neckline.
- What is the target price for an Inverse Head and Shoulders pattern?
A: The target price is often estimated by measuring the distance from the neckline to the lowest point of the head, and then adding that distance to the breakout point. This projected distance is used to set a target for potential price movement.
- Can the Inverse Head and Shoulders pattern fail?
A: Yes, like any technical analysis pattern, the Inverse Head and Shoulders pattern can fail to produce the expected outcome. Sometimes, the breakout may be false, leading to a continuation of the previous trend rather than a reversal. Traders should use stop-loss orders to manage risk.
- Is volume important in confirming the Inverse Head and Shoulders pattern?
A: Yes, volume can play a significant role in confirming the validity of the pattern. Ideally, traders prefer to see higher volume during the breakout above the neckline, indicating increased buying interest and confirming the bullish reversal.
- Are there variations of the Inverse Head and Shoulders pattern?
A: Yes, there are variations such as the complex inverse head and shoulders, which have additional peaks and troughs, making the pattern more complex but potentially offering more significant reversals. Traders should be cautious and look for confirmation signals in such variations.